


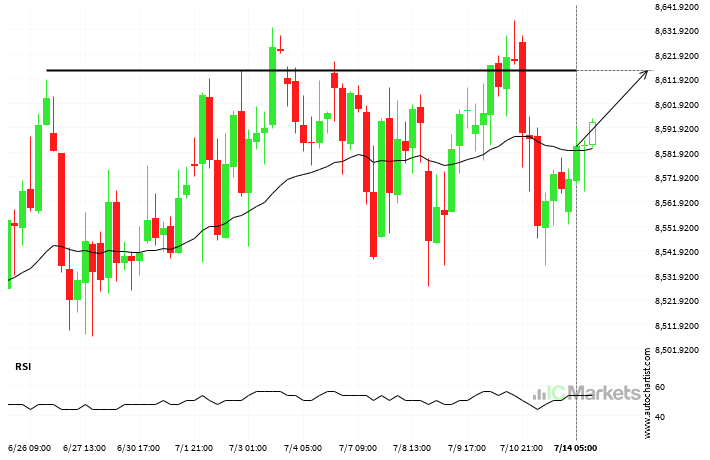
Australia 200 Index short term bullish trade setup to 8615.4004
Australia 200 Index is moving towards a line of 8615.4004 which it has tested numerous times in the past. We have seen it retrace from this position in the past, so at this stage it isn’t clear whether it will breach this price or rebound as it did before. If Australia 200 Index continues in […]
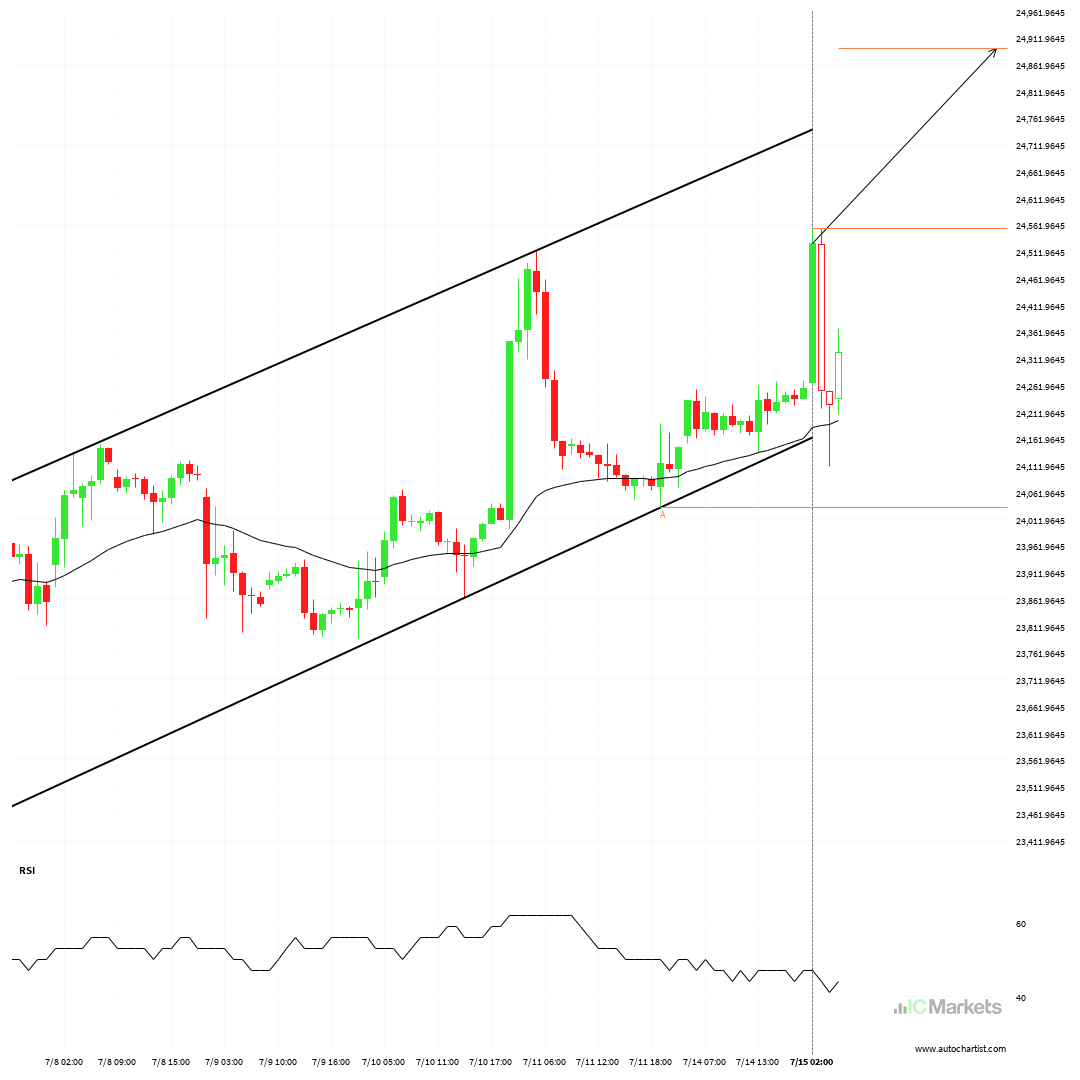
Hong Kong 50 Index – Continuation Chart Pattern – Channel Up
An emerging Channel Up has been detected on Hong Kong 50 Index on the 1 hour chart. There is a possible move towards 24891.1798 next few candles. Once reaching support it may continue its bullish run or reverse back to current price levels.
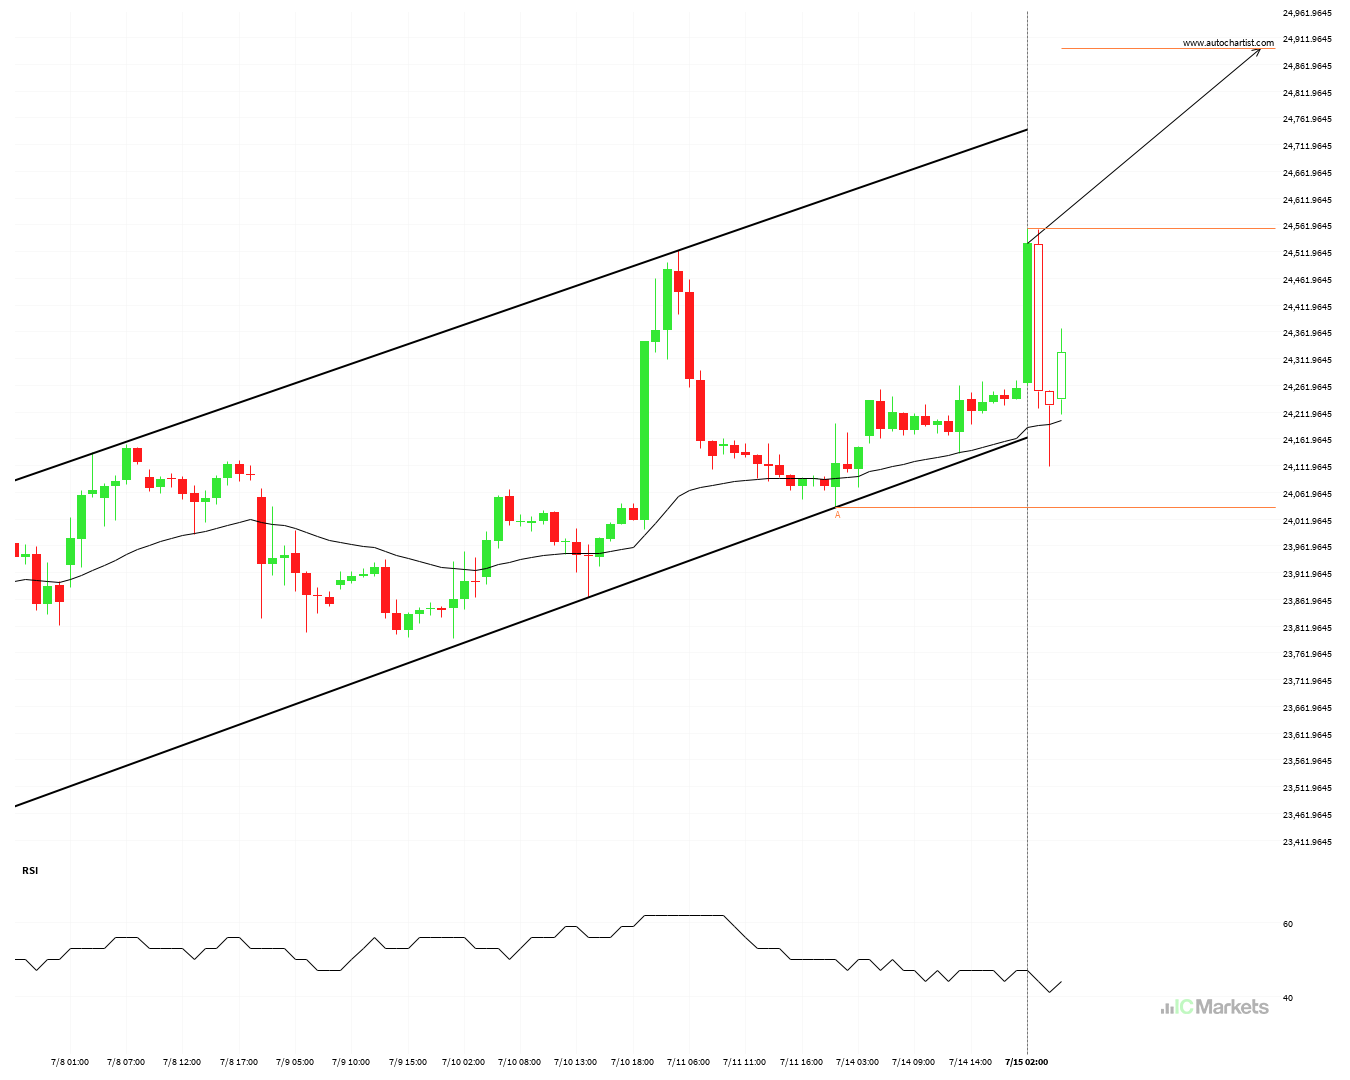
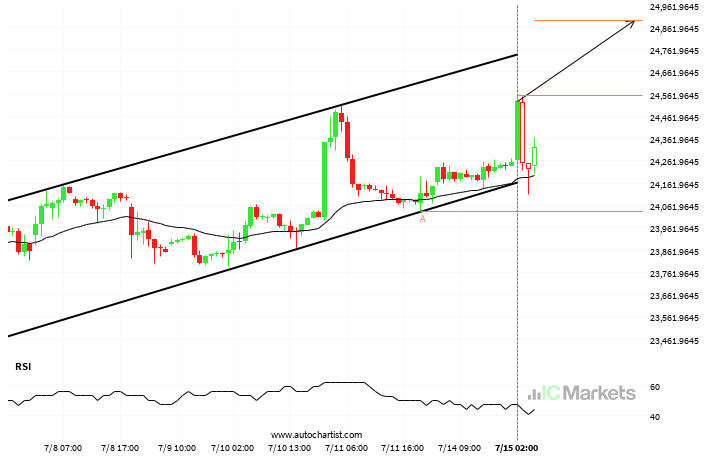
Australia 200 Index – getting close to resistance of a Ascending Triangle
Australia 200 Index is moving towards a resistance line. Because we have seen it retrace from this line before, we could see either a break through this line, or a rebound back to current levels. It has touched this line numerous times in the last 5 days and may test it again within the next […]
Huge movement on Australia 200 Index, did you miss it?
Australia 200 Index has moved lower by 0.69% from 8206.3 to 8149.32 in the last 15 hours.
Hong Kong 50 Index approaching resistance level
Hong Kong 50 Index is moving towards a line of 20785.8906 which it has tested numerous times in the past. We have seen it retrace from this position in the past, so at this stage it isn’t clear whether it will breach this price or rebound as it did before. If Hong Kong 50 Index […]
Should we expect a breakout or a rebound on Hong Kong 50 Index?
Hong Kong 50 Index is moving towards a resistance line. Because we have seen it retrace from this line before, we could see either a break through this line, or a rebound back to current levels. It has touched this line numerous times in the last 8 days and may test it again within the […]
Support breakout on FTSE China A50 Index
FTSE China A50 Index has broken through 13518.5703 which it has tested numerous times in the past. We have seen it retrace from this price in the past. If this new trend persists, FTSE China A50 Index may be heading towards 13402.4180 within the next 14 hours.